FIFA sold fifteen top-tier sponsorship slots for the 2026 World Cup. Public reporting puts Tier 1 partnerships somewhere north of $150m each and Tier 2 in the $65m to $95m range. The tournament ran for 39 days across three countries and was watched by more people than any event in human history.
We measured how long the attention lasted.
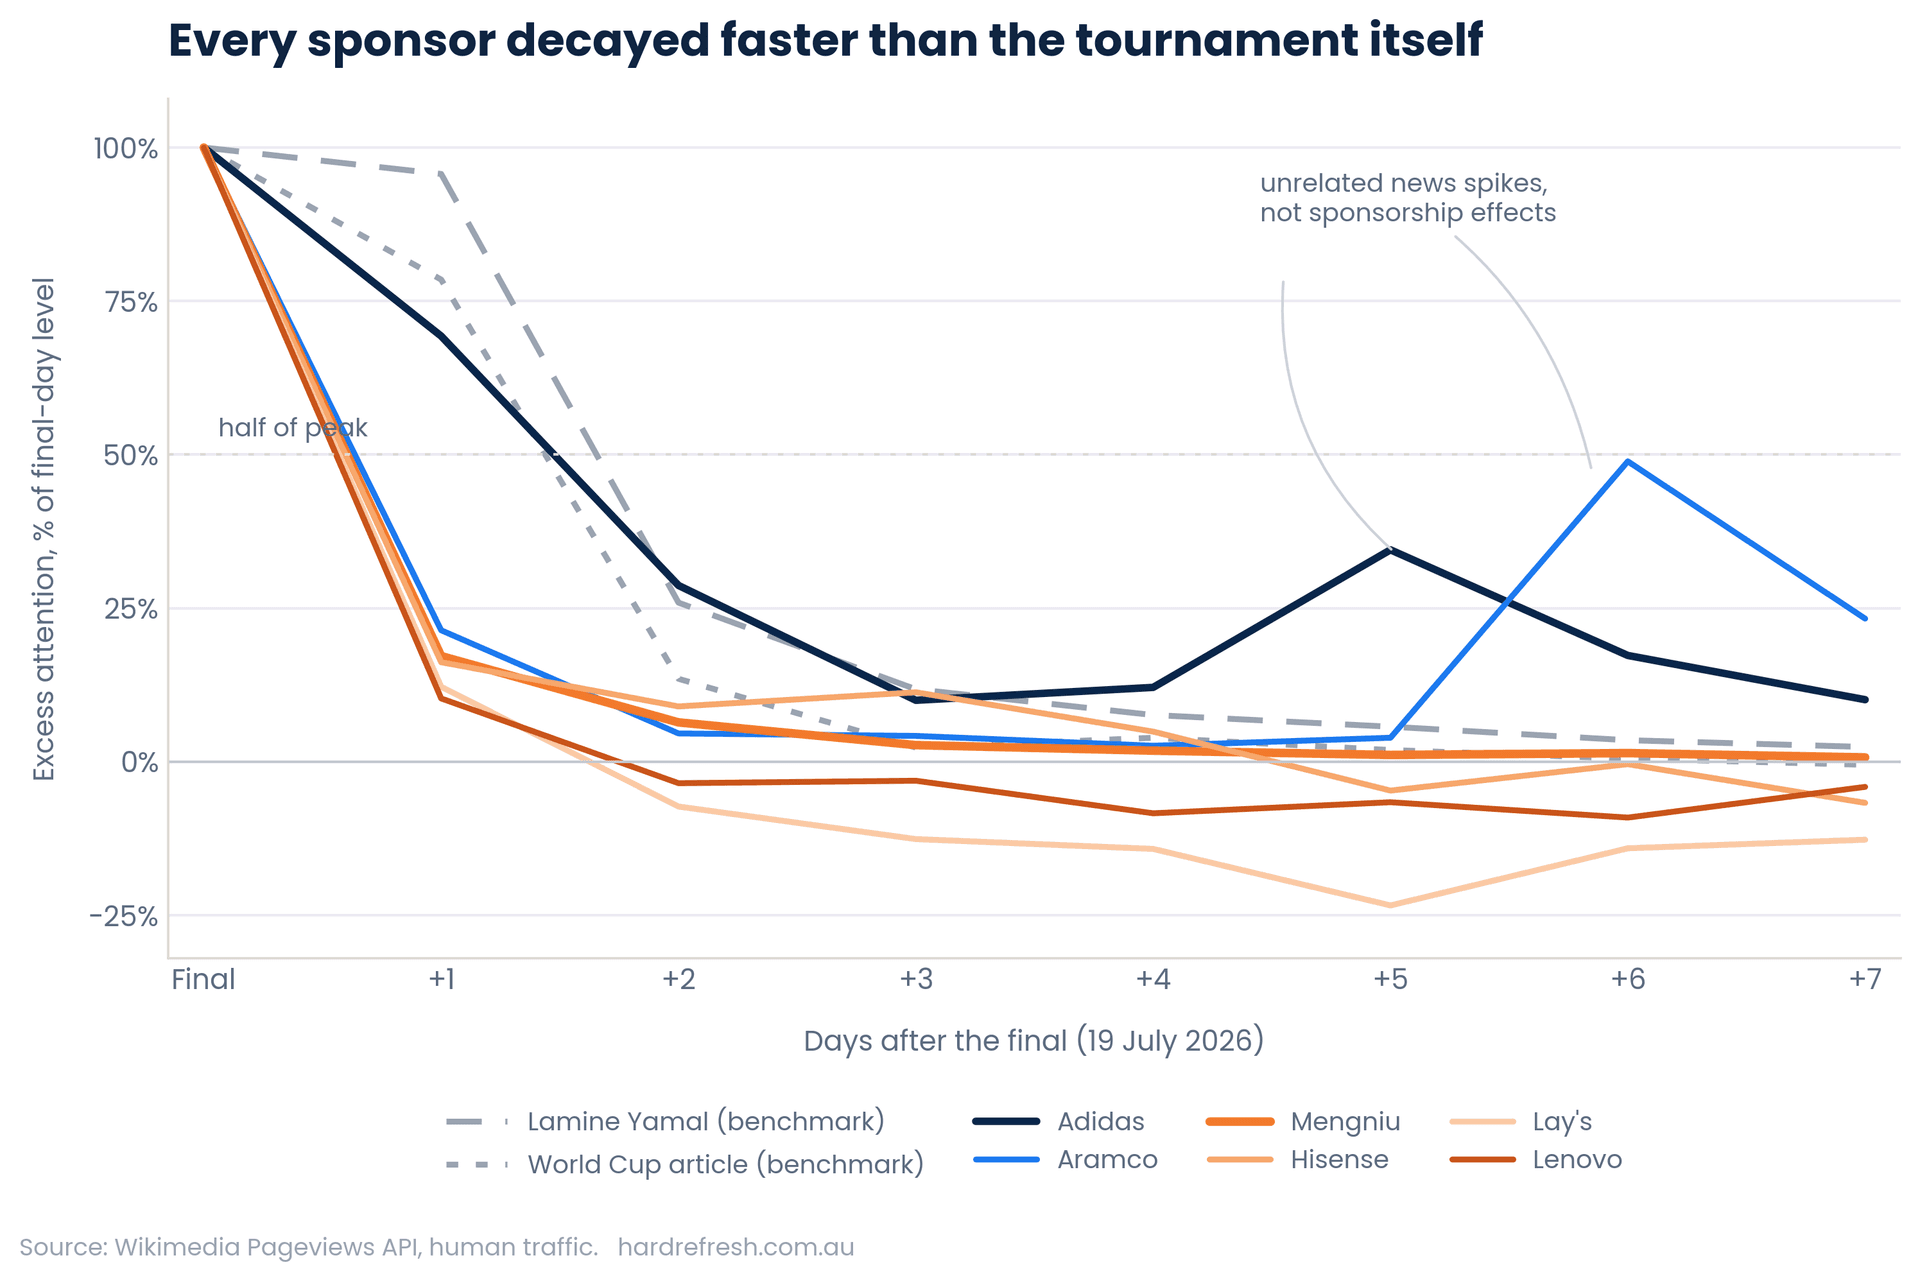
The median sponsor half-life was 0.39 days. About nine hours.
How we measured it
Wikipedia publishes daily pageview counts for every article, free, with human traffic separable from bots. When someone sees an unfamiliar logo on a stadium hoarding and wonders who that is, a fraction of them look it up. That look-up is timestamped and public.
We pulled daily human pageviews for all fifteen FIFA sponsors from 1 April to 3 August 2026. Ten weeks of pre-tournament baseline, the tournament itself, and a fortnight after the final. We deseasonalised for day-of-week, established each brand's own baseline, and measured excess attention above it.
Then we pulled ten non-sponsoring competitors: Nike and Puma against Adidas, PepsiCo against Coca-Cola, Mastercard against Visa, Burger King against McDonald's, and so on. Without a control group, "sponsor attention rose during the World Cup" is unfalsifiable.
And we pulled five benchmarks that aren't brands at all: Lamine Yamal, Ferran Torres, the Spain and Cape Verde national teams, and the Wikipedia article about the tournament itself. These tell you how fast attention fades when there's no brand equity underneath it, only news.
Thirty-one articles. The code is published.
Why not Google Trends?
The obvious alternative, and we started there.
Trends has real advantages: it's geo-native, so you can ask about Australia specifically, and a search sits closer to a purchase decision than an encyclopedia lookup does. But three things ruled it out as the primary instrument.
It returns a relative index rather than counts. Every query is scaled 0 to 100 within itself, which is fine for comparing a brand to its own past but awkward for comparing brands to each other, and it truncates the decay tail exactly where the interesting part lives. Half-life fitting needs the tail.
It has a volume floor. When we ran the Australian sponsor list through Trends, Mengniu returned no data at all, below the reporting threshold. Our single most informative brand simply wouldn't exist in the dataset.
And it's unreliable at this scale. Our first pull returned two of seventeen brands. The second returned everything but silently mixed daily and weekly reporting cadences between them.
Wikipedia gives absolute daily counts, separates human from bot traffic, has no rate limit worth worrying about, and never quietly changes its reporting resolution mid-request.
This isn't an argument that search data is worse. It's a different instrument for a different job, and running the same analysis on Trends as a convergent check is the obvious next step. If both datasets show the same familiarity effect, the finding stops depending on the quirks of either one.
The first finding: it worked
Sponsorship generated real, measurable attention lift.
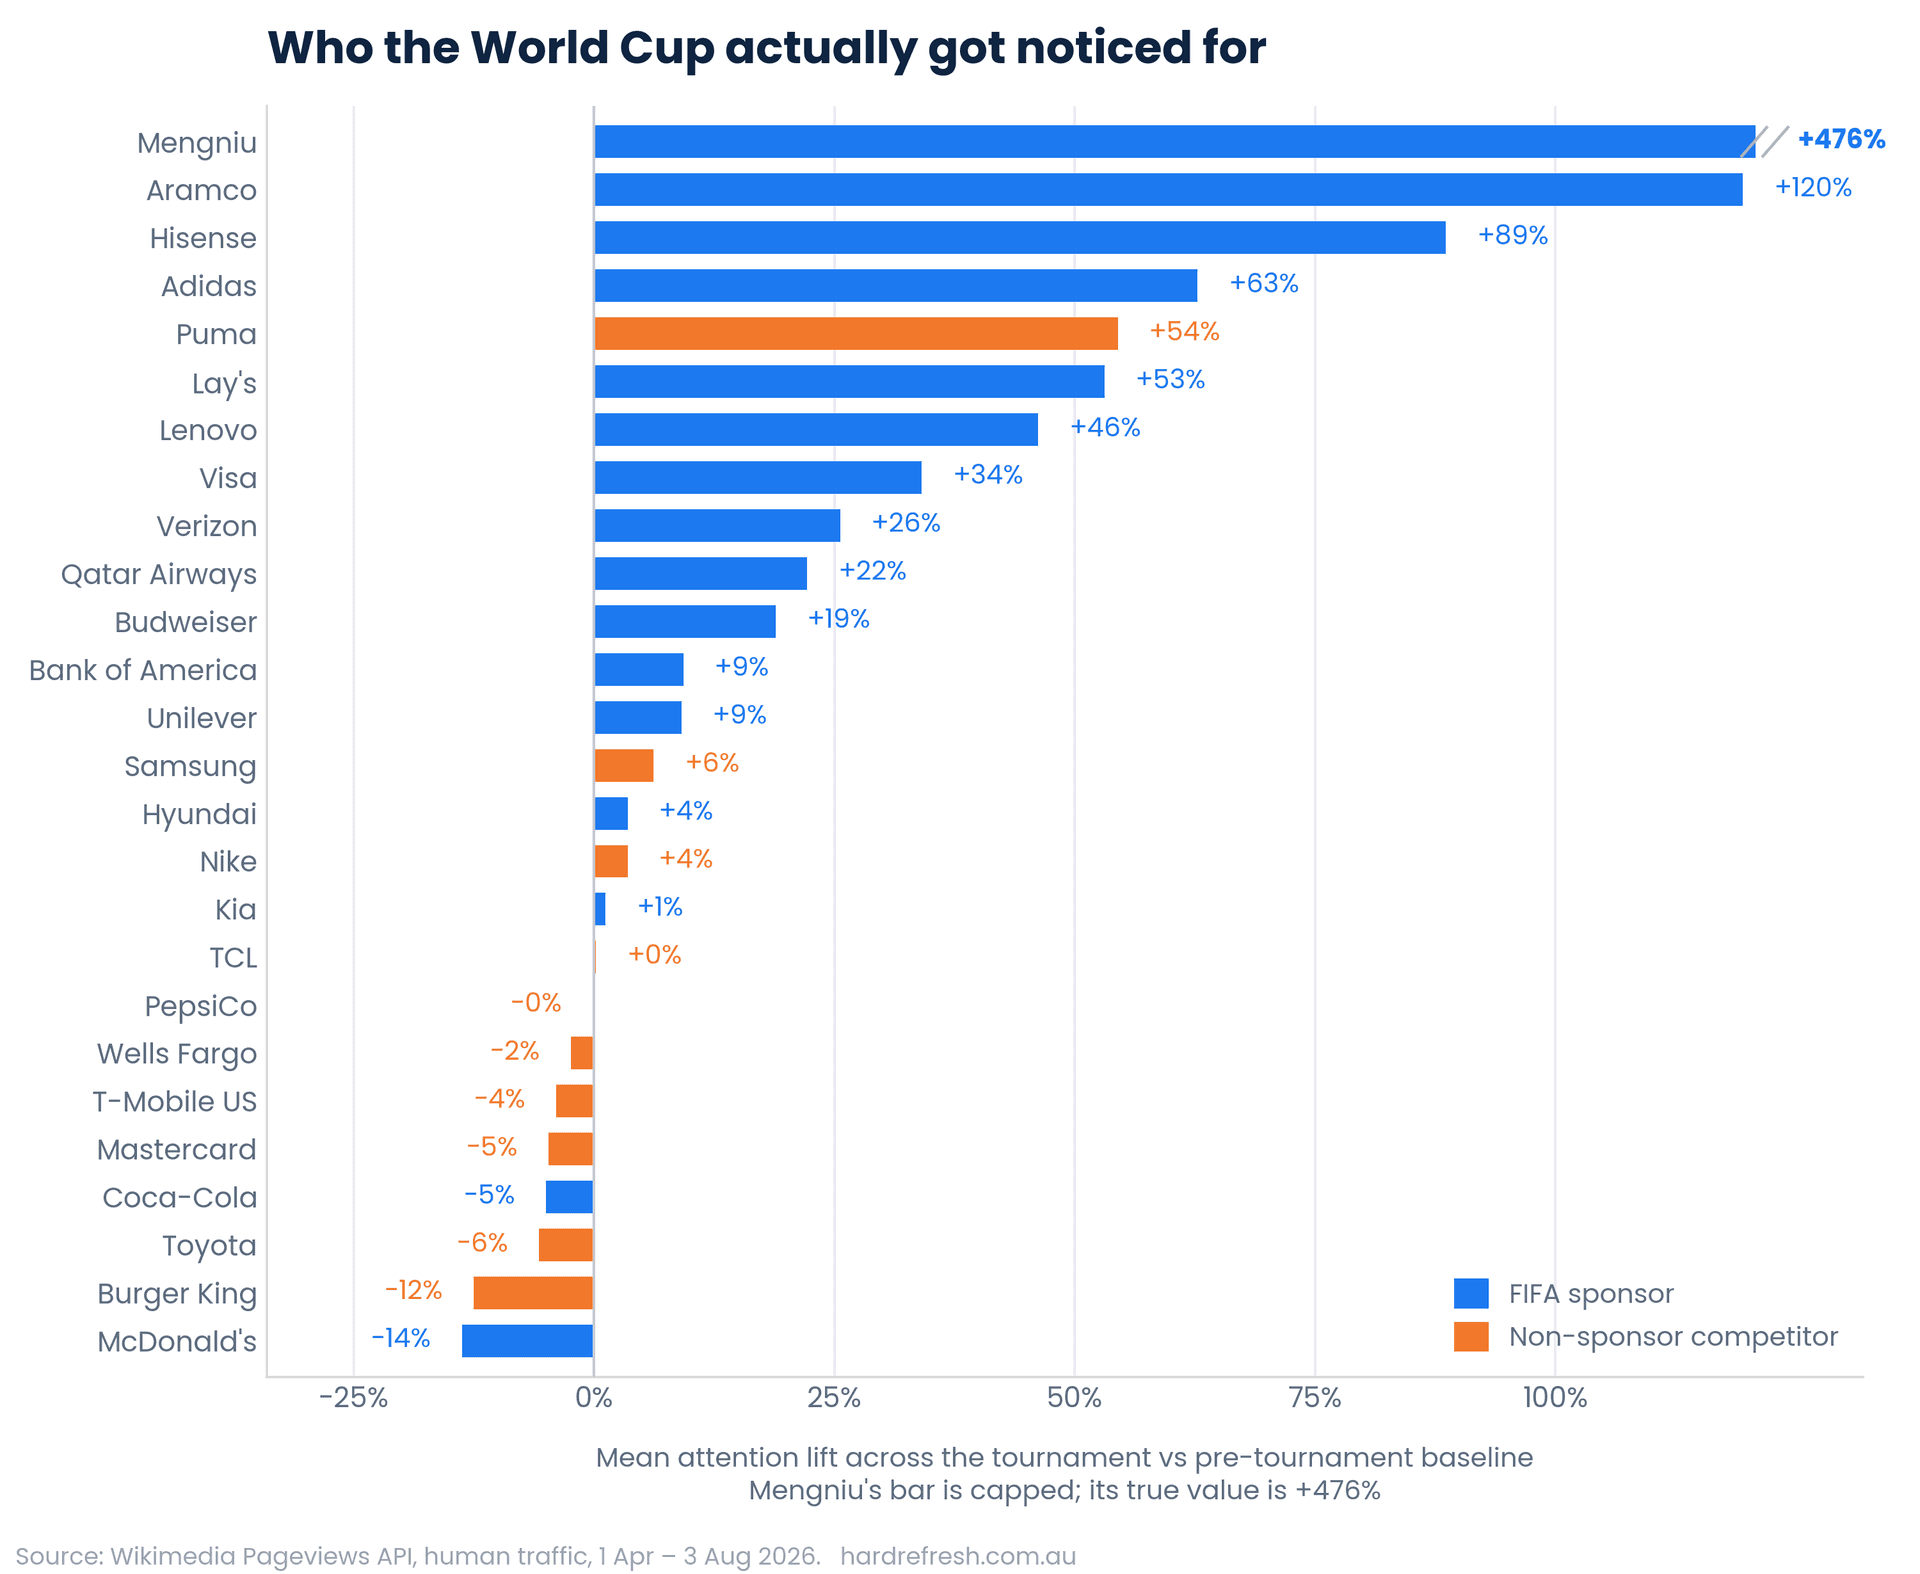
Tier 1 partners saw a median lift of 28% across the tournament. Tier 2 sponsors 22%. The non-sponsoring control group: minus 1%.
Across eleven matched pairings of sponsor against direct competitor, the sponsor came out ahead in nine. Visa beat Mastercard by 39 points. Verizon beat T-Mobile by 30. Hisense beat Samsung by 82.
That is a genuine effect and it should be said plainly, because the rest of this piece is less flattering.
The second finding: it went almost entirely to brands nobody knew
Rank the sponsors by how well known they were before the tournament, using their own baseline Wikipedia traffic as the measure, and split them down the middle.
The eight least-known sponsors gained a median of 44%. The eight best-known gained 6%.
Mengniu, a Chinese dairy company averaging 65 pageviews a day before the tournament, gained 476%. It is the single largest response in the entire dataset, and it belongs to the brand fewest people had heard of.
At the other end, Coca-Cola went backwards. Minus 5% across the tournament it sponsored. McDonald's went backwards further, minus 14%, and was beaten by Burger King, who paid FIFA nothing.
The correlation between familiarity and lift is −0.66, with a p-value of 0.006. With sixteen brands that's suggestive rather than settled, but it is the strongest pattern in the data by a distance.
What this metric captures is discovery. It is the sound of several hundred million people seeing a name and thinking who? Which means it's worth a great deal to a brand with something to explain, and close to nothing to a brand everybody already knows.
Coca-Cola cannot buy discovery. There is nothing left to discover.
The third finding: it evaporated
Here is where it stops being an interesting curiosity and starts being a procurement problem.
Excess attention decays exponentially after the final. Fitting the curve gives a half-life per brand:
| Brand | Half-life | 95% CI | Fit quality |
|---|---|---|---|
| Aramco | 0.25 days | 0.1–0.9 | R² 0.78 |
| Lenovo | 0.38 days | 0.3–0.4 | R² 1.00 |
| Mengniu | 0.38 days | 0.4–0.4 | R² 1.00 |
| Hisense | 0.40 days | 0.3–0.6 | R² 0.97 |
| Lay's | 0.50 days | 0.4–0.6 | R² 0.99 |
| Adidas | 0.94 days | 0.6–1.9 | R² 0.89 |
Median: 0.39 days.
Now compare that to the benchmarks. The Wikipedia article about the 2026 World Cup has a half-life of 1.06 days. Spain's national team, 1.11. Lamine Yamal, 1.30.
Every single sponsor decayed faster than the event they sponsored. Adidas, the best-performing brand in the set, held attention for three-quarters as long as an encyclopedia entry about the tournament. Mengniu's 476% lift, the biggest in the dataset, was more than half gone by the following afternoon and functionally back to baseline within 72 hours.
There is no meaningful plateau. Attention did not settle at a new, higher level. It went back to where it started.
What you are actually buying
Put the three findings together and the shape of the thing becomes clear.
World Cup sponsorship is sold as a brand asset, priced over a multi-year horizon, and defended in board papers with the language of equity and long-term positioning. Measured on attention, it behaves like a very expensive performance campaign with an unusually good creative: a real spike, concentrated in audiences who didn't know you, gone in under a day.
That is not necessarily a bad buy. If you are Mengniu or Hisense or Aramco, trying to establish name recognition in markets where you have none, a 476% discovery spike in front of a global audience may be worth every cent even if it lasts nine hours. Repetition across a tournament, across tournaments, is how unfamiliar brands become familiar ones.
But if you are Coca-Cola or McDonald's, you are buying something else and you should be honest about what. Category defence, retail leverage, hospitality for the trade, the cost of not letting Pepsi have it. Those are legitimate reasons. None of them are what the sponsorship was sold as, and none of them show up in an attention metric, which means nobody is measuring whether you got them.
Meanwhile Puma gained 54.5% without paying FIFA anything at all, out-performing nine of the sixteen brands who did.
What we would want a client to take from this
The measurement is the point, not the football.
Most brand investments are defended with a decay assumption nobody has tested. Adstock parameters in mix models are frequently set by convention or by whatever made the model fit. This is what it looks like when you go and measure one instead: a specific number, a confidence interval around it, a control group to prove it isn't just seasonality, and a published method so anyone can check.
The answer happened to be nine hours. For your channels it will be something else. The question is whether anyone has ever asked.
Limitations
Wikipedia measures curiosity, not awareness, consideration, or sales. A pageview is a weak signal and we would not build a media plan on it alone.
We measured English Wikipedia, which is a language rather than a market, and skews Anglophone. This understates Mengniu and Aramco in particular, whose most curious audiences read Chinese and Arabic. That Mengniu still produced the largest response in the set despite being measured in the wrong language is, if anything, an argument that the effect is bigger than we found. We're re-running the analysis across eight language editions and will publish the comparison separately.
The familiarity correlation rests on sixteen brands. The half-life finding rests on the six sponsors whose response cleared our signal threshold; the other nine never rose far enough above their own daily noise to make a decay rate meaningful, which is itself a finding. Daily data cannot resolve much below half a day, so Aramco at 0.25 is at the floor of what this method can see.
Aramco also shows an unrelated attention spike six days after the final, which is why its confidence interval is the widest in the table.
All data, code and method are published here.
Preet is a Co-Founder and Head of Data at Hard Refresh. He spends more time than is healthy asking where numbers came from. You can connect with him on LinkedIn here.